

My first index with a portfolio designed to beat the QQQ is live. Here it is

Isn’t it beautiful?
Moving forward I will be posting screenshots of the different indexes I write about on the 01Core_Indexes tab to make it easy to follow along and/or recreate the portfolios yourself (or modify them as you desire, etc). The second portfolio I’ve created will go live this week as soon as the funds clear. I’ll talk a little about the concept behind it below.
Opportunistic Secular Tailwinds
One of the equity research activities I do on a regular basis is use stock screeners. My four favorite screening criteria are:
Delete any company whose revenues haven’t paced with inflation (these companies are terminal zeros)
Select FOR companies that have rock solid balance sheets (various ways to accomplish this)
Select FOR companies whose forward multiples are lower than their historical EPS CAGR (I usually look at 3/5/10 year and want companies that have exceeded forward multiple in terms of EPS CAGR over multiple periods)
Select FOR steady and/or increasing operating margins
The criteria above are designed to avoid:
Companies whose terminal value is in question (those not keeping up with inflation)
Those who could suffer through economic troubles (bad balance sheets)
Those who are over valued (criteria #3)
Those who don’t have secular tailwinds (the most obvious sign of a secular tailwind is steadily increasing margins, and if your margins are decreasing then you obviously do NOT have secular tailwinds)
My recent obsession with homebuilders and semiconductor capital equipment companies (henceforth: semicap) is because they are the ONLY two groups of companies where most companies in the group meet the #3 criteria above (as well as all of the others).
Other companies that make it into the group are members of Big Tech, Nvidia, Arista Networks - some of the companies that you would expect to see there. But outside of the obvious candidates who all have idiosyncratic reasons for matching the criteria, only semicap and builders - as a group - meet the four criteria above.
I’ve explained in other posts on 01Core_XBytes why this is this case and why they should continue to be attractive investments.
Homebuilders/construction cos+ semiconductor capital equipment companies - the good kind of cyclical

Cyclicality comes in different flavors. Some potentially poisonous, some very fruitful. Fortunately, the flavors are easy to identify if you know what to look for. Let’s look at some charts.
Essentially - despite having massive secular tailwinds - both groups are cyclical - which results in pretty regular massive drawdowns like the ones we’re in now - which is unattractive to investors - which makes their average multiple from cycle to cycle far less than it would be were they to be given credit for their long term earnings growth trajectory.
Applied Materials is the perfect example. It goes through cycles where earnings are depressed, but over time the trend is up and to the right
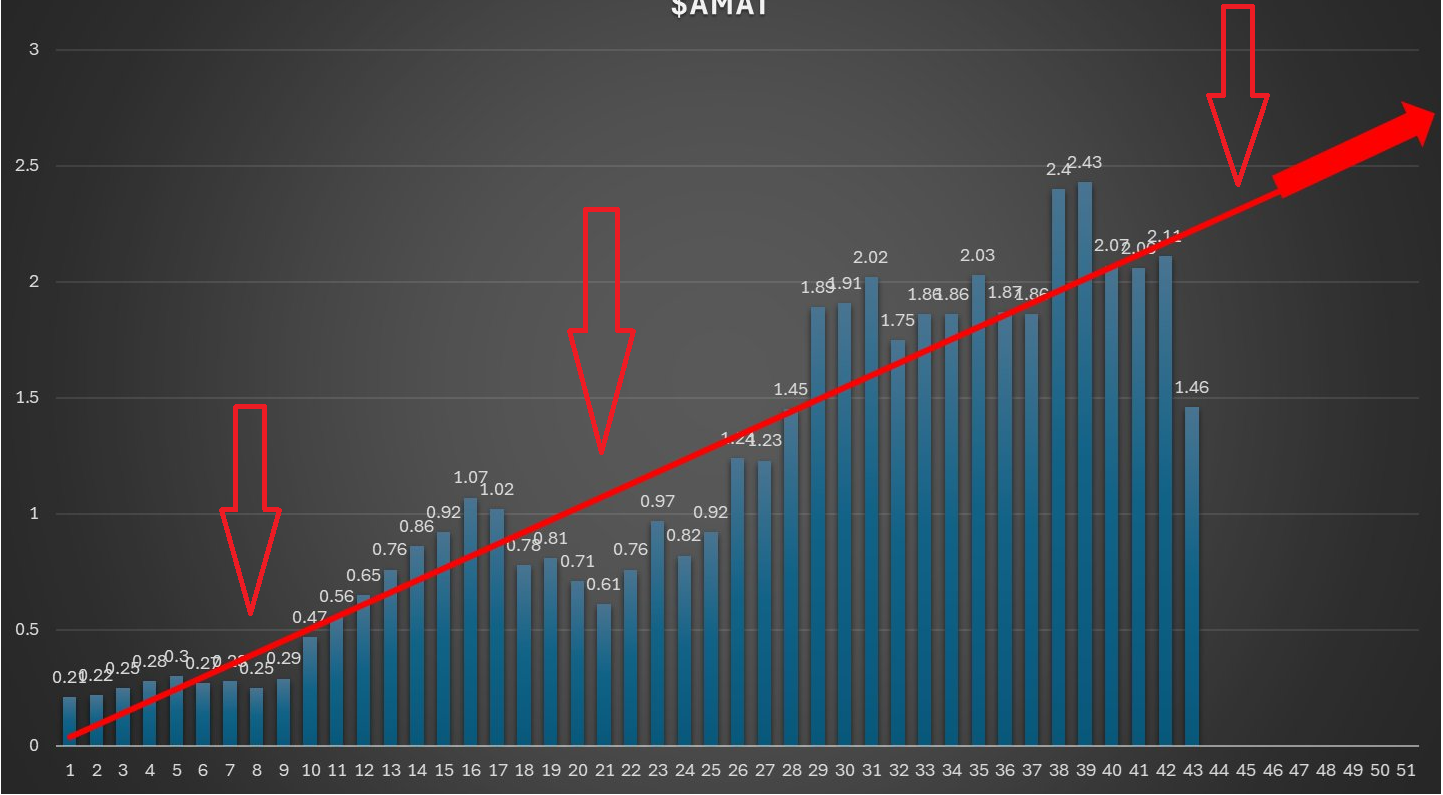
In essence, you are being paid with reliable long-term share price outperformance - in return for being willing to eat the volatility.
Portfolio strategy
The idea with this index is to pick 3 or 4 themes that are currently attractive on a valuation basis and which also benefit from strong secular tailwinds - and allocate the entire portfolio equal weighted across the themes. Among all themes and stocks I look at (which is basically the S&P 500 /Nasdaq 100 and global tech behemoths) - the three I find most attractive right now are:
Big Tech
Semicap
Builders
This index will allocate 33.3% to each theme. The sub weightings within the themes are derived from a combination of:
Current valuation relative to historical
Market cap
Uniqueness of market position (moat)
The portfolio will be revisited at the end of 365 days so that IF any adjustments to the themes are made that require realizing gains they will be long term. Here is the starting portfolio.

Imho - it is an incredibly attractive time to begin investing in this index. The weighted drawdown of the entire portfolio is 35%. The forward multiple of the portfolio is lower than the historical EPS CAGR - which is an absolutely WILD fact given how many companies are in the portfolio and how solid their long term EPS growth has been.
For reference, the average company in the S&P typically trades around 18X forward with a historical EPS CAGR of 9% - meaning the FPE / CAGR is 2!!! This compared to being way less than 1 for our index above (see below).
This next table shows the historical EPS CAGR (10yr, 5yr), the forward PE, and a new metric I’ve created for purposes of looking at the portfolio on a look through basis - which is the weighted 10yr and 5yr EPS CAGR and the weighted FPE to calculate the weighted FPE/Historical CAGR (I use the average of the 5yr and 10yr CAGR).

Remember, you want the ratio of the [forward PE] divided by [historical EPS CAGR] to be as low as possible. This is analogous to saying you want the [price you pay] to be as low as possible relative to the [earnings you get].
The ratio for the S&P 500 historically is approximately 2. The ratio for this portfolio is .66 as of today. TBF - I believe estimates for this basket are likely to drop further than estimates for the S&P500 over the next year - but I also expect that they will recover faster thereafter.
Frankly - I will be stunned if this portfolio doesn’t mog the S&P 500 over the next 2-3 years.
how do u manage such an allocation .. some software does this for u ?.. sorry if this is a noob question
I like what you are working on. 2 Other names for you to consider on the homebuilders and construction materials. $GRBK and $EXP